1. 如何定义和测量数据点之间的距离?
在数据挖掘中,衡量数据点之间的距离是聚类、分类以及关联规则等算法的基础。常用的距离度量方法包括欧氏距离、曼哈顿距离、切比雪夫距离和余弦相似度等。
参考答案:
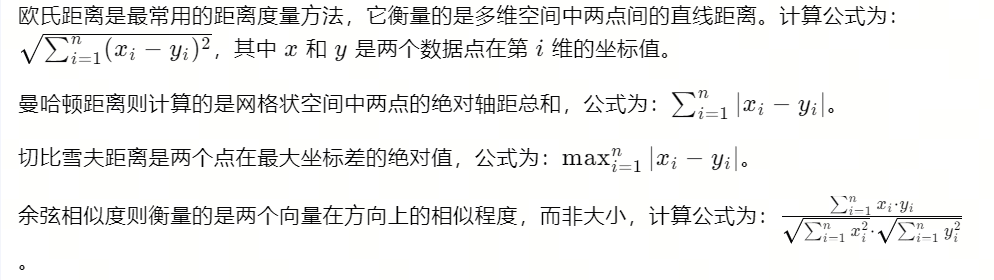
选择合适的距离度量方法需要根据实际问题和数据的特性来决定。例如,对于具有不同量纲的数据,可能需要先进行标准化处理;而对于文本数据,则可能使用余弦相似度更为合适。
2. 为什么要进行特征选择?
特征选择是数据挖掘中的一个重要步骤,它旨在从原始特征中选择出最具有预测能力的特征子集。
参考答案:进行特征选择的原因主要有以下几点:
- 降低计算复杂度:减少特征数量可以显著降低模型训练和预测的计算成本。
- 提高模型性能:去除无关或冗余特征可以减少噪声干扰,提高模型的预测准确性。
- 增强模型可解释性:较少的特征数量有助于理解模型的决策过程,提高模型的可解释性。
- 防止过拟合:通过特征选择,可以避免模型在训练数据上过度拟合,从而提高模型在新数据上的泛化能力。
特征选择的方法通常分为三类:过滤方法(Filter methods)、包装方法(Wrapper methods)和嵌入方法(Embedded methods)。过滤方法通过统计测试来评估特征的相关性;包装方法通过搜索算法来寻找最优特征子集;嵌入方法在模型训练过程中自然进行特征选择,如L1正则化的线性模型。
3. 在K-means聚类中怎么选择合适的K值?
K-means聚类算法中,K值的选择对聚类结果有着重要影响。
参考答案:选择合适的K值可以通过以下几种方法:
- 肘部法则(Elbow Method):通过计算不同K值的成本函数(如群内平方和),并绘制K与成本函数的图表。选择成本函数开始显著下降速度减缓的点作为K值,该点类似于“肘部”。
- 轮廓系数(Silhouette Coefficient):计算不同K值的轮廓系数,选择轮廓系数最大的K值。轮廓系数结合了聚类的凝聚度和分离度,值越大表示聚类效果越好。
- 交叉验证(Cross-validation):对数据进行多次划分训练集和测试集,计算不同K值在测试集上的性能,选择性能最好的K值。
- 稳定性分析(Stability Analysis):多次运行K-means算法,观察不同K值下聚类结果的稳定性。选择在多次运行中稳定性较高的K值。
选择合适的K值需要综合考虑数据的特性、问题的需求以及计算资源的可用性。
4. 什么是交叉验证?怎么使用?为什么要使用?
交叉验证是一种评估模型泛化能力的技术。
参考答案:交叉验证的主要目的是通过重复使用数据集的不同部分来训练和验证模型,从而减少模型评估过程中的偶然性,提高模型选择的可靠性。
使用交叉验证的步骤通常包括:
- 将数据集分割成K个大小相等的子集(或尽可能相等)。
- 每次取其中一个子集作为测试集,剩余的K-1个子集作为训练集。
- 重复步骤2,直到每个子集都被用作过测试集。
- 计算K次模型的性能指标的平均值,作为模型的最终评估结果。
交叉验证的常见类型有K折交叉验证(K-fold Cross-validation)和留一法交叉验证(Leave-One-Out Cross-Validation)等。K折交叉验证将数据集分为K个部分,每次用其中的一部分作为测试集,其余作为训练集,重复K次。留一法交叉验证则是每次只用一个数据点作为测试集,其余全部作为训练集,重复N次,其中N是数据点的总数。
交叉验证的优点在于能够充分利用有限的数据资源,提高模型评估的稳定性和可靠性。此外,它还可以用于模型选择和超参数调优,帮助找到最优的模型配置。
5. 逻辑回归系数和胜算比之间有什么关系?
逻辑回归是一种广泛使用的分类算法,其输出的是胜算比(Odds Ratio),而非概率。
参考答案:
这表明,模型系数直接影响胜算比的对数值。每增加一个单位的特征值,胜算比会按照模型系数的对数倍变化。如果系数为正,则增加该特征值会增加胜算比,即增加样本属于正类的概率;如果系数为负,则减少样本属于正类的概率。
理解逻辑回归系数与胜算比之间的关系,有助于我们解释模型的预测结果,并进行特征的重要性分析。
6. 主成分分析(PCA)和线性判别分析(LDA)之间存在什么样的区别和联系?
PCA和LDA都是降维技术,但它们的目的和方法有所不同。
参考答案:主成分分析(PCA)是一种无监督的降维技术,其目标是找到一个新的特征空间,使得在这个空间中数据的方差最大化。PCA通过正交变换将原始数据转换到一个新的坐标系统中,新坐标的基向量(即主成分)是原始数据协方差矩阵的特征向量。第一主成分是数据方差最大的方向,第二主成分是与第一主成分正交且方差次大的方向,以此类推。
线性判别分析(LDA)是一种有监督的降维技术,其目标是找到一个新的特征空间,使得在这个空间中类间距离最大化,同时类内距离最小化。LDA假设不同类别的数据服从高斯分布,且具有相同的协方差矩阵。LDA通过计算类别间散度矩阵和类内散度矩阵来找到最佳的投影方向。
PCA和LDA的联系在于它们都通过线性变换来降低数据的维度。但它们的不同之处在于PCA关注数据的全局结构,而LDA关注数据的类别结构。因此,在没有类别标签的情况下,我们通常使用PCA进行降维;而在有类别标签的情况下,如果目标是提高分类性能,我们则倾向于使用LDA。
7. 什么是过拟合?有哪些方法可以预防或克服过拟合?
过拟合是指模型在训练数据上表现良好,但在未见过的测试数据上表现不佳的现象。这通常是因为模型学习到了训练数据中的噪声和细节,而没有捕捉到数据的潜在分布。
参考答案:预防或克服过拟合的方法主要包括:
- 增加数据量:通过获取更多的训练数据来减少模型对训练集中特定噪声的学习。
- 特征选择:减少特征的数量,只保留最重要的特征,以降低模型复杂度。
- 正则化:在损失函数中添加正则项(如L1或L2正则化),对模型参数施加惩罚,限制模型复杂度。
- 交叉验证:使用交叉验证来评估模型的泛化能力,并选择最佳的模型参数。
- 早停法(Early Stopping):在训练过程中,当验证集上的性能不再提升或开始下降时停止训练,以避免过拟合。
- 集成学习:结合多个模型的预测结果,如随机森林、Bagging和Boosting等方法,以减少过拟合。
- 简化模型:选择更简单的模型,如线性模型,避免使用过于复杂的模型结构。
- 数据增强:通过对训练数据进行变换(如旋转、缩放、裁剪等),生成新的训练样本,以增加数据的多样性。
- 超参数调优:通过调整模型的超参数来找到最佳的模型配置,避免过拟合。
在实际应用中,通常需要结合多种方法来有效地预防和克服过拟合,以提高模型在新数据上的表现。
8. 什么是混淆矩阵?如何使用混淆矩阵评估分类模型的性能?
混淆矩阵是一个表格,用于描述分类模型的性能。
参考答案:混淆矩阵通常包含四个部分:真正例(TP)、假正例(FP)、真负例(TN)和假负例(FN)。它们分别表示:
- TP:模型正确预测为正类的样本数。
- FP:模型错误预测为正类的样本数。
- TN:模型正确预测为负类的样本数。
- FN:模型错误预测为负类的样本数。
这些指标可以帮助我们从不同角度评估模型的性能。例如,精确率关注模型预测为正类的样本中实际为正类的比例,而召回率关注所有实际正类样本中被模型正确预测的比例。F1分数则是精确率和召回率的调和平均,它在不平衡类别分布的情况下特别有用。
混淆矩阵不仅能够评估模型的整体性能,还能够揭示模型在不同类别上的性能差异,帮助我们识别模型的弱点并进行改进。
9. 什么是决策树?如何构建一个决策树模型?
决策树是一种常见的分类和回归模型,它模拟了人类决策过程中的决策树形结构。
参考答案:决策树通过递归地将数据集分割成越来越小的子集来构建模型。每个分割对应于树中的一个节点,最终的子集对应于树的叶节点。在每个内部节点上,模型选择一个特征进行分割,并根据该特征的某个阈值将数据分为两部分。分割的目的是为了提高子集的纯度,即使得同一子集中的数据尽可能属于同一类别。
构建决策树的步骤通常包括:
- 特征选择:选择一个最佳的特征进行分割。常用的方法有信息增益(ID3算法)、信息增益比(C4.5算法)和基尼不纯度(CART算法)。
- 树的生成:根据特征选择的结果,递归地分割数据集,直到满足停止条件(如达到预设深度、节点中的样本数小于某个阈值、或子集纯度达到某个标准)。
- 剪枝:为了防止过拟合,对生成的树进行剪枝。剪枝可以是预剪枝(在生成树的过程中就停止树的增长)或后剪枝(先生成完整的树,然后删除不必要的节点)。
决策树的优点在于模型易于理解和解释,计算复杂度不高。但它也容易受到噪声和异常值的影响,可能导致过拟合。此外,决策树可能不稳定,即数据中的小变化可能导致生成完全不同的树。
10. 什么是支持向量机(SVM)?SVM如何在特征空间中寻找最优分割?
支持向量机(SVM)是一种强大的分类算法,它的目标是找到一个超平面,以最大化不同类别之间的边界(或称为间隔)。
参考答案:SVM的基本思想是找到一个超平面(在二维空间中是一条直线,在三维空间中是一个平面,以此类推),使得两个类别之间的间隔最大化。间隔是指数据点到决策边界的最小距离。SVM通过最大化间隔来提高模型的泛化能力。
在特征空间中寻找最优分割的步骤包括:
- 构建目标函数:SVM的目标函数是找到一个能够最大化间隔的超平面。目标函数通常涉及间隔的大小和分类错误的样本数。
- 求解优化问题:SVM的训练过程实际上是一个求解凸二次规划问题,通过优化算法(如序列最小优化SMO算法)来求解最优解。
- 支持向量:在优化过程中,只有部分数据点(即支持向量)对最终的决策边界有影响。支持向量是距离决策边界最近的数据点,它们决定了间隔的大小和位置。
- 核技巧:当数据不是线性可分时,SVM使用核函数将原始特征映射到高维空间,以便在新的空间中找到线性分割。常用的核函数包括线性核、多项式核、径向基函数(RBF)核和sigmoid核。
SVM的优点在于它能够处理线性和非线性问题,且具有较好的泛化能力。但SVM的缺点是参数选择(如C参数和核参数)对模型性能影响较大,且在大规模数据集上训练可能比较耗时。
11. 什么是随机森林?它与决策树有何不同?
随机森林是一种集成学习方法,它通过构建多个决策树并将它们的预测结果进行汇总来提高模型的准确性和稳定性。
参考答案:随机森林的主要特点包括:
- 集成多个决策树:随机森林由多个决策树组成,每棵树都是独立训练的。
- 引入随机性:在构建每棵决策树时,随机森林引入两种随机性。第一种是自助采样(Bootstrap sampling),即对原始数据集进行有放回的随机采样来构建每棵树的训练集。第二种是在分裂节点时不是考虑所有特征,而是考虑一个随机选择的特征子集。
- 投票或平均决策:随机森林通过对所有决策树的预测结果进行投票(分类问题)或平均(回归问题)来得出最终的预测。
与单一决策树相比,随机森林的优点在于:
- 减少过拟合:由于引入了随机性,随机森林能够降低模型的方差,从而减少过拟合的风险。
- 提高准确性:通过集成多个决策树,随机森林通常能够获得比单一决策树更高的预测准确性。
- 增强稳定性:随机森林对异常值和噪声的鲁棒性更强,因为它依赖于多个树的集体智慧。
随机森林的缺点是模型的可解释性不如单一决策树,因为它包含了大量的决策树,难以直观地理解模型的决策过程。
12. 什么是梯度下降?它在机器学习中有什么作用?
梯度下降是一种用于优化问题的迭代算法,它在机器学习中主要用于最小化损失函数,以找到模型参数的最优解。
参考答案:梯度下降的基本思想是从一个初始点开始,沿着损失函数下降最快的方向逐步更新参数,直到达到局部最小值或全局最小值。损失函数是衡量模型预测值与实际值差异的函数,它反映了模型的性能。
在机器学习中,梯度下降的作用包括:
- 参数优化:通过最小化损失函数,梯度下降帮助我们找到最佳的模型参数,使得模型在训练数据上的表现最佳。
- 模型训练:几乎所有的监督学习算法,如线性回归、逻辑回归、神经网络等,都可以使用梯度下降进行训练。
- 泛化能力:通过合理选择学习率和迭代次数,梯度下降可以防止模型过拟合,提高模型在新数据上的泛化能力。
13. 什么是L1正则化和L2正则化?它们在机器学习中的作用是什么?
L1正则化和L2正则化是两种常用的正则化技术,用于防止机器学习模型过拟合。
参考答案:L1正则化,也称为Lasso(Least Absolute Shrinkage and Selection Operator)正则化,其惩罚项是模型参数的绝对值之和。在优化过程中,L1正则化倾向于产生稀疏的参数向量,即许多参数会变为零。这种特性使得L1正则化同时具有特征选择的功能,能够从众多特征中选择出最有影响力的特征,从而简化模型。
L2正则化,也称为Ridge(Residual Reduction and Interpretation for Distance)正则化,其惩罚项是模型参数的平方和。与L1正则化不同,L2正则化不会将参数压缩至零,而是倾向于使所有参数值接近零但不会完全为零。这种特性有助于防止模型中的参数过大,从而减少模型复杂度和过拟合的风险。
在机器学习中,正则化的作用主要体现在以下几点:
- 防止过拟合:通过在损失函数中添加正则化项,可以惩罚大的参数值,从而限制模型的复杂度,减少过拟合。
- 特征选择:L1正则化通过产生稀疏参数向量,能够选择重要的特征,提高模型的可解释性。
- 参数平滑:L2正则化通过对参数值进行平滑处理,减少了参数的敏感性,提高了模型的泛化能力。
在实际应用中,通常会根据数据的特点和模型的需求选择合适的正则化方法。有时,也会结合L1和L2正则化,这种方法称为Elastic Net正则化。
14. 什么是主成分分析(PCA)?它在数据挖掘中有哪些应用?
主成分分析(PCA)是一种统计方法,用于数据降维和模式识别。
参考答案:PCA的目标是将可能存在多重共线性的变量转换为一组线性不相关的变量,这组新变量称为主成分。PCA通过正交变换将原始数据投影到较低维度的空间中,同时尽可能保留数据的变异性。
在数据挖掘中,PCA的应用包括:
- 数据降维:通过减少数据的维度,PCA可以简化模型的复杂度,减少计算资源的消耗。
- 去噪:PCA能够帮助去除数据中的噪声,突出数据中的主要特征。
- 可视化:在高维数据集中,直观的可视化是困难的。PCA可以将数据降至二维或三维空间,便于可视化和分析。
- 特征提取:PCA生成的主成分可以作为新的特征集,用于后续的机器学习任务。
- 预处理:在许多机器学习算法中,PCA可以作为一种预处理步骤,提高算法的性能。
PCA的有效性建立在数据的中心化和尺度化的基础上。在应用PCA之前,通常需要对数据进行标准化处理,以消除不同量纲和尺度的影响。
15. 什么是K-means算法?它是如何工作的?
K-means算法是一种经典的聚类算法,用于将数据划分为K个簇。
参考答案:K-means算法的基本思想是根据数据点之间的相似性将它们分组。算法的工作原理可以分为以下几个步骤:
- 初始化:随机选择K个数据点作为初始的簇中心。
- 分配步骤:将每个数据点分配给最近的簇中心,形成K个簇。
- 更新步骤:重新计算每个簇的中心,通常取簇内所有数据点的均值。
- 迭代:重复分配和更新步骤,直到簇中心不再发生变化,或者达到预设的迭代次数。
K-means算法的优点在于简单、易于实现,通常能够得到较好的聚类效果。然而,它也有一些局限性:
- K值的选择:需要事先指定K值,而在实际应用中K值往往是未知的。
- 初始簇中心的选择:算法的结果依赖于初始簇中心的选择,不同的初始值可能导致不同的聚类结果。
- 对噪声和异常值敏感:K-means算法容易受到噪声和异常值的影响。
- 可能收敛到局部最优:算法可能会收敛到局部最优解,而不是全局最优解。
尽管存在这些局限性,K-means仍然是解决许多聚类问题的有效工具。
16. 什么是时间序列分析?它在数据挖掘中的重要性是什么?
时间序列分析是统计学和机器学习中的一种分析方法,用于分析按时间顺序排列的数据点。
参考答案:时间序列数据是一系列按照时间顺序排列的数据点,时间序列分析的目标是从这些数据中提取有用的信息,预测未来的趋势,以及理解数据的内在结构和模式。
在数据挖掘中,时间序列分析的重要性体现在以下几个方面:
- 趋势分析:通过分析时间序列数据的长期趋势,可以预测未来的走势,为决策提供依据。
- 季节性分析:识别数据的季节性模式,如销售数据的季节性波动,有助于优化资源分配和库存管理。
- 异常检测:在时间序列数据中识别异常点,如信用卡欺诈检测、工业设备的故障预警等。
- 因果关系分析:分析不同时间序列之间的相互关系,确定它们之间是否存在因果关系。
- 预测:基于历史数据构建模型,预测未来的数据点,如股票价格、气温变化等。
时间序列分析的方法包括自回归模型(AR)、移动平均模型(MA)、自回归移动平均模型(ARMA)、自回归积分滑动平均模型(ARIMA)等。在机器学习领域,还可以使用神经网络、支持向量机等方法进行时间序列预测。
17. 什么是关联规则学习?它在零售业中的应用有哪些?
关联规则学习是一种挖掘大量数据中变量之间有趣关系的方法。
参考答案:关联规则学习的目标是发现数据项之间的频繁模式、关联或者相关性。在零售业中,关联规则学习通常用于分析顾客的购物篮数据,以发现不同商品之间的购买关系。
在零售业中,关联规则学习的应用包括:
- 购物篮分析:通过分析顾客的交易记录,发现哪些商品经常被一起购买,如“买尿布的顾客也往往会购买啤酒”。
- 商品推荐:根据顾客的购买历史推荐相关商品,提高交叉销售和增值销售的机会。
- 库存管理:通过关联规则优化库存水平,确保高需求商品的供应。
- 促销活动设计:基于商品之间的关联关系设计捆绑促销或交叉促销活动。
- 市场篮分析:分析整个市场或特定客户群体的购买模式,以制定更有效的市场策略。
关联规则学习的经典算法包括Apriori算法和FP-growth算法。Apriori算法通过迭代地发现所有频繁项集,然后从这些频繁项集中导出关联规则。FP-growth算法则使用一种称为FP树(Frequent Pattern Tree)的数据结构来高效地发现频繁项集和生成关联规则。
18. 什么是深度学习?它与传统机器学习有何区别?
深度学习是机器学习的一个分支,它使用多层神经网络来学习数据的高层次特征。
参考答案:深度学习的核心是深度神经网络(Deep Neural Networks, DNNs),这种网络包含多个隐藏层,能够捕捉数据中的复杂结构和模式。与传统机器学习相比,深度学习的特点在于:
- 模型复杂度:深度学习模型通常具有更高的模型复杂度,能够学习数据的深层特征。
- 特征学习:深度学习模型能够自动从原始数据中学习到有用的特征表示,无需人工设计特征。
- 数据量:深度学习通常需要大量的标记数据来训练,而传统机器学习模型在小数据集上表现可能更好。
- 计算资源:深度学习模型的训练需要较大的计算资源,尤其是GPU,而传统机器学习模型通常对计算资源的要求较低。
深度学习在图像识别、语音识别、自然语言处理等领域取得了显著的成果。代表性的深度学习模型包括卷积神经网络(CNNs)、循环神经网络(RNNs)、长短时记忆网络(LSTMs)等。
19. 什么是自然语言处理(NLP)?它在数据挖掘中的应用有哪些?
自然语言处理(NLP)是计算机科学、人工智能和语言学领域的交叉学科,旨在使计算机能够理解和处理人类语言。
参考答案:NLP的研究内容包括语言模型、句法分析、语义分析、情感分析、机器翻译、问答系统、文本摘要等。在数据挖掘中,NLP的应用非常广泛,主要包括:
- 文本分类:通过NLP技术,可以将文本数据自动分类到预定义的类别中,如垃圾邮件检测、新闻分类等。
- 情感分析:分析文本中的情感倾向,如正面、负面或中性,用于市场分析、产品反馈等。
- 主题建模:从文档集合中发现主要的主题或概念,如使用LDA(Latent Dirichlet Allocation)模型。
- 实体识别:从文本中识别出具体的实体,如人名、地名、组织名等。
- 关系抽取:识别文本中实体之间的关系,如“公司-CEO”、“电影-导演”等。
- 文本聚类:将文本数据根据内容的相似性进行聚类,无需预先定义
20. 什么是决策树的剪枝?它如何影响模型的性能?
决策树的剪枝是指在构建决策树过程中,通过某种策略去除一些子树,以防止模型过拟合。
参考答案:决策树的剪枝可以分为预剪枝和后剪枝两种方法。预剪枝在决策树的生长过程中就进行剪枝,而后剪枝则是在决策树完全生长后进行。
预剪枝方法通常在每个节点的分裂判断中加入一个阈值,例如,如果一个节点的纯度提升或信息增益低于某个阈值,则该节点不再分裂。这样可以避免树过于复杂,减少噪声的影响,但可能会导致欠拟合。
后剪枝则是在决策树完全生成后,从树的底部开始,检查每个非叶子节点。如果移除该节点后的子树能够使得模型的预测性能不下降或者提高,那么就进行剪枝。后剪枝的优点是可以利用验证集来评估剪枝的效果,但计算成本较高。
剪枝对模型性能的影响主要体现在以下几个方面:
- 减少过拟合:通过移除不必要的子树,剪枝可以降低模型的复杂度,减少过拟合的风险。
- 提高泛化能力:剪枝后的模型在新的数据上可能具有更好的预测能力,因为它减少了对训练数据的依赖。
- 提升解释性:剪枝后的决策树更加简洁,便于理解和解释。
- 计算效率:剪枝后的树更小,因此在进行预测时计算效率更高。
然而,剪枝也可能带来一些风险,如过度剪枝可能导致模型失去有用的信息,从而影响预测性能。
21. 什么是集成学习?它如何提高模型的准确性?
集成学习是一种机器学习范式,它通过结合多个模型的预测结果来提高整体的预测性能。
参考答案:集成学习的基本思想是“三个臭皮匠,赛过诸葛亮”,即通过组合多个模型的预测结果,可以比单一模型获得更好的性能。集成学习的方法主要分为三类:Bagging、Boosting和Stacking。
Bagging(Bootstrap Aggregating)是通过随机采样技术并行地训练多个模型,然后通过投票(分类问题)或平均(回归问题)的方式来整合模型的预测结果。随机森林就是一种基于Bagging的集成学习方法。
Boosting则是顺序地训练模型,每一个模型都试图纠正前一个模型的错误。Boosting方法的代表是AdaBoost和梯度提升(Gradient Boosting)。
Stacking(Stacked Generalization)则是将不同模型的预测结果作为输入,训练一个新的模型来进行最终的预测。这种方法可以结合不同模型的优势,提高预测的准确性。
集成学习提高模型准确性的方式主要有:
- 降低方差:通过组合多个模型,可以降低单个模型由于随机性导致的高方差问题。
- 降低偏差:不同模型可能从不同的角度捕捉数据的特征,集成学习可以减少模型的偏差。
- 提高鲁棒性:集成学习可以减少模型对异常值和噪声的敏感性。
- 利用多样性:不同模型可能具有不同的优缺点,集成学习可以利用这种多样性来提升整体性能。
22. 什么是维度灾难?它是如何影响机器学习模型的?
维度灾难是指当数据的维度(特征数量)增加时,机器学习模型的性能急剧下降,甚至无法有效学习。
参考答案:维度灾难的存在主要是因为随着维度的增加,数据点在高维空间中趋于稀疏,这使得模型难以从有限的数据中学习到有效的模式。具体来说,维度灾难会对机器学习模型产生以下影响:
- 过拟合:在高维空间中,模型可能会学习到数据中的噪声和偶然规律,而不是真正的潜在模式,导致过拟合。
- 计算复杂度:高维数据需要更多的计算资源来进行处理和分析,增加了模型训练和预测的计算成本。
- 数据稀疏性:在高维空间中,数据点之间的距离变得非常大,这使得基于距离的算法(如K-means、KNN)效果变差。
- 特征冗余:高维数据中可能存在许多冗余或相关性很高的特征,这些特征会干扰模型的学习过程。
为了应对维度灾难,可以采取以下措施:
- 特征选择:通过选择最有信息量的特征来减少数据的维度。
- 特征提取:使用PCA等方法将高维数据转换到低维空间。
- 正则化:通过在损失函数中添加正则化项来控制模型的复杂度。
- 数据增强:通过生成新的数据点来增加数据的多样性。
23. 什么是梯度提升树(GBDT)?它与决策树有何区别?
梯度提升树是一种集成学习算法,它通过迭代地构建一系列弱学习器(通常是决策树),然后组合它们的预测结果来提高整体模型的性能。
参考答案:梯度提升树的基本思想是在每一次迭代中,根据当前模型的残差(即前一轮模型预测与真实值的差)来构建一个新的弱学习器。新学习器的目标是拟合这个残差,从而减少模型的误差。通过逐步累加这些弱学习器的预测结果,GBDT能够构建出一个强学习器。
与单一决策树相比,GBDT的主要区别在于:
- 集成多个决策树:GBDT通过集成多个决策树来提高模型的准确性和稳定性。
- 逐步优化:GBDT在每一步都针对当前模型的残差进行优化,这使得模型能够更精细地拟合数据。
- 正则化:GBDT中的学习器由于逐步累加,可以引入正则化项来控制模型的复杂度,防止过拟合。
GBDT的优点包括处理各种数据类型的能力、能够自然地处理高维数据、不需要对数据进行复杂的预处理等。然而,GBDT也有一些缺点,如训练过程可能比较慢,模型可能比较复杂,需要仔细调整超参数等。
24. 什么是神经网络?它是如何用于分类和回归问题的?
神经网络是一种受人脑结构启发的计算模型,它由大量的节点(或称为神经元)组成,这些节点通过连接权重进行信息传递和处理。
参考答案:神经网络的基本单元是神经元,它接收输入信号,通过激活函数处理后输出到其他神经元。一个典型的神经网络包含输入层、隐藏层和输出层。输入层接收原始数据,隐藏层负责提取特征和进行非线性变换,输出层则根据任务的不同进行分类或回归。
在分类问题中,神经网络的输出层通常使用softmax函数,它可以将输出转换为概率分布,表示样本属于各个类别的概率。在训练过程中,通过反向传播算法和梯度下降等优化方法,不断调整网络中的权重和偏置,以最小化预测值和真实值之间的差异。
在回归问题中,神经网络的输出层则不使用softmax函数,而是直接输出连续值。同样地,通过反向传播和优化算法来调整网络参数,使得网络的预测输出尽可能接近真实的目标值。
神经网络的优点在于它能够自动学习数据的复杂模式,无需人为设计特征。此外,深度神经网络(具有多个隐藏层的神经网络)在图像识别、语音识别、自然语言处理等领域取得了显著的成果。
25. 什么是深度学习中的过拟合问题?如何避免或减轻过拟合?
过拟合是指深度学习模型在训练数据上表现得非常好,但在未见过的测试数据上表现不佳的现象。这通常是因为模型学习到了训练数据中的噪声和细节,而没有捕捉到数据的潜在分布。
参考答案:避免或减轻过拟合的方法主要包括:
- 数据增强:通过对训练数据进行变换(如旋转、缩放、裁剪等),生成新的训练样本,以增加数据的多样性。
- 正则化:在损失函数中添加正则项(如L1或L2正则化),对模型参数施加惩罚,限制模型复杂度。
- 交叉验证:使用交叉验证来评估模型的泛化能力,并选择最佳的模型参数。
- 早停法(Early Stopping):在训练过程中,当验证集上的性能不再提升或开始下降时停止训练,以避免过拟合。
- 集成学习:结合多个模型的预测结果,如随机森林、Bagging和Boosting等方法,以减少过拟合。
- 简化模型:选择更简单的模型,如线性模型,避免使用过于复杂的模型结构。
- 超参数调优:通过调整模型的超参数来找到最佳的模型配置,避免过拟合。
- Dropout:在训练过程中随机丢弃(即暂时移除)网络中的一些节点,减少节点之间复杂的共适应关系。
- 批量归一化(Batch Normalization):在网络的每一层之后对激活值进行归一化处理,以减少内部协变量偏移。
在实际应用中,通常需要结合多种方法来有效地预防和克服过拟合,以提高模型在新数据上的表现。
26. 什么是卷积神经网络(CNN)中的池化层?它的作用是什么?
池化层是卷积神经网络中的一种结构,通常位于卷积层之后。
参考答案:池化层的作用是对卷积层输出的特征图(feature map)进行下采样,减少数据的空间尺寸,从而减少计算量和防止过拟合。池化操作通常包括最大池化(Max Pooling)和平均池化(Average Pooling)两种。
最大池化是从特征图的局部区域中提取最大值,这有助于突出最重要的特征,同时保持特征的不变性。平均池化则是计算局部区域内所有值的平均值,有助于平滑特征。
池化层的作用主要包括:
- 降低维度:减少后续层的参数数量和计算量,提高计算效率。
- 防止过拟合:通过降低特征的空间分辨率,减少模型对小的变化和噪声的敏感度。
- 增加不变性:池化操作使得模型对输入数据的小的平移、旋转和缩放具有一定程度的不变性。
27. 什么是循环神经网络(RNN)?它在序列数据处理中的优势是什么?
循环神经网络是一种专门用于处理序列数据的神经网络。
参考答案:RNN的特点是网络中存在着循环,即网络的输出不仅依赖于当前输入,还依赖于之前的状态。这种结构使得RNN能够处理任意长度的序列数据,并在序列的时间步之间传递信息。
RNN在序列数据处理中的优势主要包括:
- 处理变长序列:RNN能够处理不同长度的输入序列,无需固定的输入尺寸。
- 捕捉时序依赖:RNN能够捕捉序列数据中的时间依赖关系,对于时序预测任务特别有效。
- 动态特征提取:RNN可以根据输入序列的动态变化自动调整特征提取的过程。
RNN的挑战在于训练过程中的梯度消失或梯度爆炸问题,这使得网络难以学习长距离的依赖关系。为了解决这个问题,研究者提出了长短时记忆网络(LSTM)和门控循环单元(GRU)等变种。
28. 如何从已存在的特征中导出新特征?导出新特征的方法有哪些?
从已存在的特征中导出新特征是特征工程中的一个重要步骤,可以提高模型的预测能力。
参考答案:导出新特征的方法主要包括:
- 数学变换:对原始特征进行数学运算,如对数、平方、开方、倒数等,以获得新的特征。
- 特征组合:将两个或多个特征组合成一个新的特征,例如,特征的乘积、商、差等。
- 多项式特征:使用原始特征的多项式组合,如二次项、交互项等,以捕捉特征间的复杂关系。
- 分箱(Binning):将连续特征离散化成几个区间,每个区间作为一个新的特征。
- 文本特征提取:对于文本数据,可以使用TF-IDF、Word2Vec、WordHash等方法提取特征。
- 时间序列特征:对于时间序列数据,可以提取趋势、季节性、周期性等特征。
- 特征编码:对分类特征进行编码,如独热编码(One-Hot Encoding)、标签编码(Label Encoding)等。
- 降维技术:使用PCA、LDA等降维技术,将多个特征映射到一个低维空间,生成新的特征。
导出新特征时,需要考虑新特征是否能够提供额外的信息,以及是否能够改善模型的性能。同时,过多的特征可能会导致过拟合,因此需要通过特征选择或正则化等方法来控制特征的数量和质量。
29. 什么是样本不平衡问题?在机器学习中如何处理样本不平衡?
样本不平衡是指在数据集中,不同类别的样本数量相差悬殊。
参考答案:样本不平衡问题可能导致机器学习模型偏向于多数类,而忽视少数类,从而影响模型对少数类的预测性能。处理样本不平衡的方法主要包括:
- 重采样:通过对多数类进行下采样或对少数类进行上采样,使得不同类别的样本数量接近。下采样可以通过随机删除多数类的样本实现,而上采样可以通过复制少数类的样本或生成新的合成样本实现。
- 修改损失函数:对损失函数进行调整,增加少数类样本的权重,使得模型在训练过程中更加关注少数类。
- 集成学习:使用集成学习方法,如Bagging和Boosting,结合多个模型的预测结果,提高对少数类的识别能力。
- 代价敏感学习:在模型训练过程中引入代价函数,对不同类别的错误分类赋予不同的代价,使得模型更加关注少数类。
- 异常检测:将少数类视为异常点,使用异常检测算法来识别这些样本。
处理样本不平衡问题时,需要根据具体的数据和任务来选择合适的方法,并进行适当的调参和验证。
30. 什么是逻辑回归?它与线性回归有什么区别?
逻辑回归是一种广泛使用的分类算法,其输出的是胜算比(Odds Ratio),而非概率。
参考答案:逻辑回归模型的目标是估计给定输入特征下,样本属于某类的概率。在逻辑回归中,我们使用胜算比来表示正类的概率与负类的概率之比。
逻辑回归和线性回归的主要区别在于:
- 输出类型:线性回归用于预测连续的数值型目标变量,而逻辑回归用于预测二分类或多分类问题的概率。
- 激活函数:逻辑回归使用sigmoid函数或其他非线性激活函数将线性回归的输出映射到(0,1)区间,表示概率。
- 损失函数:逻辑回归使用交叉熵损失函数(Cross-Entropy Loss),而线性回归使用均方误差(Mean Squared Error, MSE)作为损失函数。
- 系数解释:在逻辑回归中,系数表示特征对胜算比的变化率,而在线性回归中,系数表示特征对目标变量的直接影响。