python源码实现线性回归并绘图
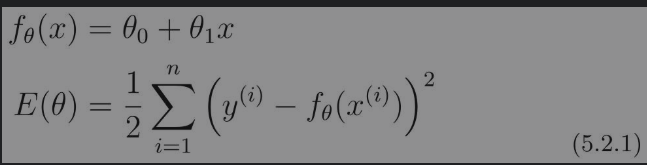
用python实现一次函数 的线性回归。把fθ(x)作为一次函数来实现吧。我们要实现下面这样的fθ(x)和目标函数E(θ)。
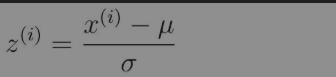
要把下面的训练数据变成平均值为0、方差为1的数据。作用是参数的收敛会更快。这种做法也被称为标准化或者z-score规范化,变换表达式是这样的。µ是训练数据的平均值,σ是标准差。
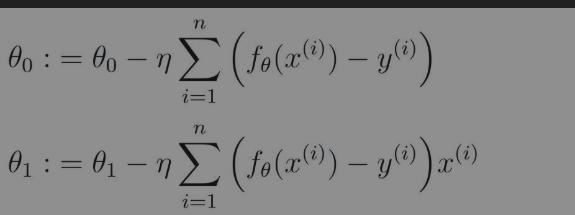
参数更新表达式如下:
训练数据如下:
x	y
235	591
216	539
148	413
35	310
85	308
204	519
49	325
25	332
173	498
191	498
134	392
99	334
117	385
112	387
162	425
272	659
159	400
159	427
59	319
198	522
import numpy as np
import matplotlib.pyplot as plt
# 读入训练数据
train = np.loadtxt('click.csv', delimiter=',', dtype='int', skiprows=1)
train_x = train[:,0]
train_y = train[:,1]
# 标准化
mu = train_x.mean()
sigma = train_x.std()
def standardize(x):
return (x - mu) / sigma
train_z = standardize(train_x)
# 参数初始化
theta0 = np.random.rand()
theta1 = np.random.rand()
# 预测函数
def f(x):
return theta0 + theta1 * x
# 目标函数
def E(x, y):
return 0.5 * np.sum((y - f(x)) ** 2)
# 学习率
ETA = 1e-3
# 误差的差值
diff = 1
# 更新次数
count = 0
# 直到误差的差值小于 0.01 为止,重复参数更新
error = E(train_z, train_y)
while diff > 1e-2:
# 更新结果保存到临时变量
tmp_theta0 = theta0 - ETA * np.sum((f(train_z) - train_y))
tmp_theta1 = theta1 - ETA * np.sum((f(train_z) - train_y) * train_z)
# 更新参数
theta0 = tmp_theta0
theta1 = tmp_theta1
# 计算与上一次误差的差值
current_error = E(train_z, train_y)
diff = error - current_error
error = current_error
# 输出日志
count += 1
log = '第 {} 次 : theta0 = {:.3f}, theta1 = {:.3f}, 差值 = {:.4f}'
print(log.format(count, theta0, theta1, diff))
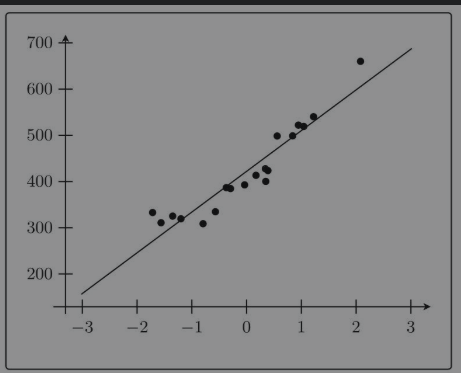
# 绘图确认
x = np.linspace(-3, 3, 100)
plt.plot(train_z, train_y, 'o')
plt.plot(x, f(x))
plt.show()最终输出图形如下:
关注公众号“大模型全栈程序员”回复“小程序”获取1000个小程序打包源码。更多免费资源在http://www.gitweixin.com/?p=2627