带富文本解析折线图的财经微信小程序
在微信小程序实现类似同花顺app的功能:
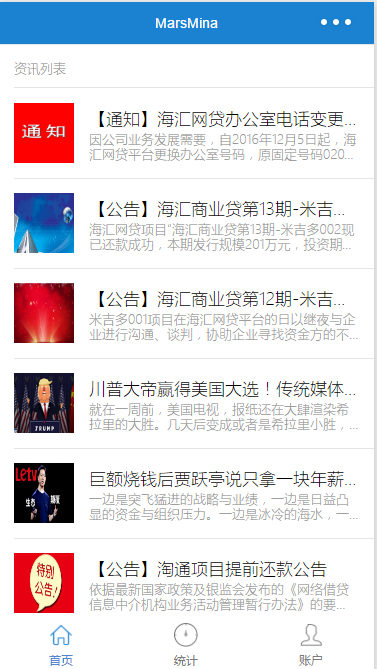
资讯列表:富文本,图文混排
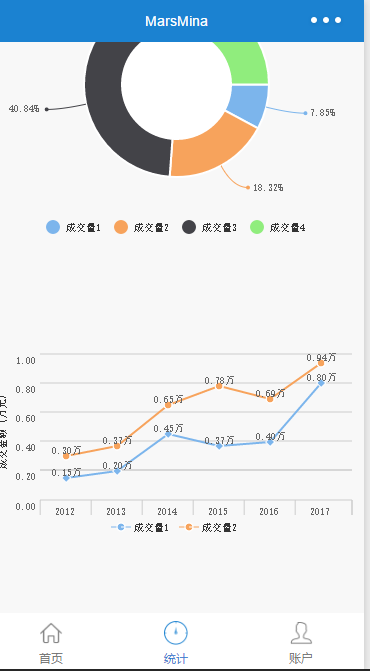
统计:饼图、折线图统计
登录注册


var _charts = require('../plugins/charts')

var CHARTS = function () { }

//形成饼图
CHARTS.shapePie = function (params) {
    new _charts({
        canvasId: params.canvas_id,
        type: 'pie',
        series: params.data,
        width: params.width,
        height: 300,
        dataLabel: true
    });
}

//形成折线图
CHARTS.shapeLine = function (params) {
    new _charts({
        canvasId: params.canvas_id,
        type: 'line',
        categories: params.xcate,
        series: params.data,
        yAxis: {
            title: params.ytitle,
            format: function (val) {
                return val.toFixed(2);
            },
            min: 0
        },
        width: params.width,
        height: 200
    });
}

//形成环形图
CHARTS.shapeRing = function (params) {
    new _charts({
        canvasId: params.canvas_id,
        type: 'ring',
        series: params.data,
        width: params.width,
        height: 300,
        dataLabel: true
    });
}

module.exports = CHARTS;
var Promise = require('../plugins/bluebird.core.min.js')
var HtmlToJson = require('../plugins/html2wxml')

var MARS = function () { }

MARS.query = function (options) {
    return new Promise((resolve, reject) => {
        wx.request({
            url: options.url,
            data: Object.assign({}, options.data),
            header: { 'content-type': 'application/json' },
            success: resolve,
            fail: reject
        })
    })
}

MARS.result = function (options) {
    return this.query(options).then(res => res)
}

MARS.html2json = function (html) {
    if (arguments.length > 1) {
        throw new Error('params error');
    }
    let r = /\s+(?=<)/g;
    html = html.replace(r, '');
    let nhtml = HtmlToJson.html2json(html);
    return nhtml;
}

MARS.json2html = function (json) {
    if (arguments.length > 1) {
        throw new Error('params error');
    }
    return HtmlToJson.json2html(json);
}


module.exports = MARS
/*
* charts for WeChat small app v1.0
*
* https://github.com/xiaolin3303/wx-charts
* 2016-11-28
*
* Designed and built with all the love of Web
*/
'use strict';
var config = {
yAxisWidth: 15,
yAxisSplit: 5,
xAxisHeight: 15,
legendHeight: 15,
yAxisTitleWidth: 15,
padding: 12,
columePadding: 10,
fontSize: 10,
dataPointShape: ['diamond', 'circle', 'triangle', 'rect'],
colors: ['#7cb5ec', '#f7a35c', '#434348', '#90ed7d', '#f15c80', '#8085e9'],
pieChartLinePadding: 25,
pieChartTextPadding: 15
};
// Object.assign polyfill
// https://developer.mozilla.org/en/docs/Web/JavaScript/Reference/Global_Objects/Object/assign
function assign(target, varArgs) {
if (target == null) {
// TypeError if undefined or null
throw new TypeError('Cannot convert undefined or null to object');
}
var to = Object(target);
for (var index = 1; index < arguments.length; index++) {
var nextSource = arguments[index];
if (nextSource != null) {
// Skip over if undefined or null
for (var nextKey in nextSource) {
// Avoid bugs when hasOwnProperty is shadowed
if (Object.prototype.hasOwnProperty.call(nextSource, nextKey)) {
to[nextKey] = nextSource[nextKey];
}
}
}
}
return to;
}
var util = {
toFixed: function toFixed(num, limit) {
limit = limit || 2;
if (this.isFloat(num)) {
num = num.toFixed(limit);
}
return num;
},
isFloat: function isFloat(num) {
return num % 1 !== 0;
},
isSameSign: function isSameSign(num1, num2) {
return Math.abs(num1) === num1 && Math.abs(num2) === num2 || Math.abs(num1) !== num1 && Math.abs(num2) !== num2;
},
isSameXCoordinateArea: function isSameXCoordinateArea(p1, p2) {
return this.isSameSign(p1.x, p2.x);
},
isCollision: function isCollision(obj1, obj2) {
obj1.end = {};
obj1.end.x = obj1.start.x + obj1.width;
obj1.end.y = obj1.start.y - obj1.height;
obj2.end = {};
obj2.end.x = obj2.start.x + obj2.width;
obj2.end.y = obj2.start.y - obj2.height;
var flag = obj2.start.x > obj1.end.x || obj2.end.x < obj1.start.x || obj2.end.y > obj1.start.y || obj2.start.y < obj1.end.y;
return !flag;
}
};
function findRange(num, type, limit) {
if (isNaN(num)) {
throw new Error('unvalid series data!');
}
limit = limit || 10;
type = type ? type : 'upper';
var multiple = 1;
while (limit < 1) {
limit *= 10;
multiple *= 10;
}
if (type === 'upper') {
num = Math.ceil(num * multiple);
} else {
num = Math.floor(num * multiple);
}
while (num % limit !== 0) {
if (type === 'upper') {
num++;
} else {
num--;
}
}
return num / multiple;
}
function convertCoordinateOrigin(x, y, center) {
return {
x: center.x + x,
y: center.y - y
};
}
function avoidCollision(obj, target) {
if (target) {
// is collision test
while (util.isCollision(obj, target)) {
if (obj.start.x > 0) {
obj.start.y--;
} else if (obj.start.x < 0) {
obj.start.y++;
} else {
if (obj.start.y > 0) {
obj.start.y++;
} else {
obj.start.y--;
}
}
}
}
return obj;
}
function fillSeriesColor(series, config) {
var index = 0;
return series.map(function (item) {
if (!item.color) {
item.color = config.colors[index];
index = (index + 1) % config.colors.length;
}
return item;
});
}
function getDataRange(minData, maxData) {
var limit = 0;
var range = maxData - minData;
if (range >= 10000) {
limit = 1000;
} else if (range >= 1000) {
limit = 100;
} else if (range >= 100) {
limit = 10;
} else if (range >= 10) {
limit = 5;
} else if (range >= 1) {
limit = 1;
} else if (range >= 0.1) {
limit = 0.1;
} else {
limit = 0.01;
}
return {
minRange: findRange(minData, 'lower', limit),
maxRange: findRange(maxData, 'upper', limit)
};
}
function mesureText(text) {
// wx canvas 未实现mesureText方法, 此处自行实现
text = String(text);
var text = text.split('');
var width = 0;
text.forEach(function (item) {
if (/[a-zA-Z]/.test(item)) {
width += 7;
} else if (/[0-9]/.test(item)) {
width += 5.5;
} else if (/\./.test(item)) {
width += 2.7;
} else if (/-/.test(item)) {
width += 3.25;
} else if (/[\u4e00-\u9fa5]/.test(item)) {
width += 10;
} else if (/\(|\)/.test(item)) {
width += 3.73;
} else if (/\s/.test(item)) {
width += 2.5;
} else if (/%/.test(item)) {
width += 8;
} else {
width += 10;
}
});
return width;
}
function dataCombine(series) {
return series.reduce(function (a, b) {
return (a.data ? a.data : a).concat(b.data);
}, []);
}
function getPieDataPoints(series) {
var process = arguments.length > 1 && arguments[1] !== undefined ? arguments[1] : 1;
var count = 0;
var _start_ = 0;
series.forEach(function (item) {
count += item.data;
});
series.forEach(function (item) {
item._proportion_ = item.data / count * process;
});
series.forEach(function (item) {
item._start_ = _start_;
_start_ += 2 * item._proportion_ * Math.PI;
});
return series;
}
function getPieTextMaxLength(series) {
series = getPieDataPoints(series);
var maxLength = 0;
series.forEach(function (item) {
var text = item.format ? item.format(+item._proportion_.toFixed(2)) : util.toFixed(item._proportion_ * 100) + '%';
maxLength = Math.max(maxLength, mesureText(text));
});
return maxLength;
}
function fixColumeData(points, eachSpacing, columnLen, index, config) {
return points.map(function (item) {
item.width = (eachSpacing - 2 * config.columePadding) / columnLen;
item.x = item.x - eachSpacing / 2 + config.columePadding + (index + 0.5) * item.width;
item.width = Math.round(item.width);
item.x = Math.round(item.x);
return item;
});
}
function getXAxisPoints(categories, opts, config) {
var yAxisTotleWidth = config.yAxisWidth + config.yAxisTitleWidth;
var spacingValid = opts.width - 2 * config.padding - yAxisTotleWidth;
var eachSpacing = Math.floor(spacingValid / categories.length);
var xAxisPoints = [];
var startX = config.padding + yAxisTotleWidth;
var endX = opts.width - config.padding;
categories.forEach(function (item, index) {
xAxisPoints.push(startX + index * eachSpacing);
});
xAxisPoints.push(endX);
return { xAxisPoints: xAxisPoints, startX: startX, endX: endX, eachSpacing: eachSpacing };
}
function getDataPoints(data, minRange, maxRange, xAxisPoints, eachSpacing, opts, config) {
var process = arguments.length > 7 && arguments[7] !== undefined ? arguments[7] : 1;
var points = [];
var validHeight = opts.height - 2 * config.padding - config.xAxisHeight - config.legendHeight;
data.forEach(function (item, index) {
var point = {};
point.x = xAxisPoints[index] + Math.round(eachSpacing / 2);
var height = validHeight * (item - minRange) / (maxRange - minRange);
height *= process;
point.y = opts.height - config.xAxisHeight - config.legendHeight - Math.round(height) - config.padding;
points.push(point);
});
return points;
}
function getYAxisTextList(series, opts, config) {
var data = dataCombine(series);
var minData = typeof opts.yAxis.min === 'number' ? opts.yAxis.min : Math.min.apply(this, data);
var maxData = Math.max.apply(this, data);
var dataRange = getDataRange(minData, maxData);
var minRange = dataRange.minRange;
var maxRange = dataRange.maxRange;
var range = [];
var eachRange = (maxRange - minRange) / config.yAxisSplit;
for (var i = 0; i <= config.yAxisSplit; i++) {
range.push(minRange + eachRange * i);
}
return range.reverse();
}
function calYAxisData(series, opts, config) {
var ranges = getYAxisTextList(series, opts, config);
var yAxisWidth = config.yAxisWidth;
var rangesFormat = ranges.map(function (item) {
item = util.toFixed(item, 2);
item = opts.yAxis.format ? opts.yAxis.format(Number(item)) : item;
yAxisWidth = Math.max(yAxisWidth, mesureText(item) + 5);
return item;
});
return { rangesFormat: rangesFormat, ranges: ranges, yAxisWidth: yAxisWidth };
}
function drawPointShape(points, color, shape, context) {
context.beginPath();
context.setStrokeStyle("#ffffff");
context.setLineWidth(1);
context.setFillStyle(color);
if (shape === 'diamond') {
points.forEach(function (item, index) {
context.moveTo(item.x, item.y - 4.5);
context.lineTo(item.x - 4.5, item.y);
context.lineTo(item.x, item.y + 4.5);
context.lineTo(item.x + 4.5, item.y);
context.lineTo(item.x, item.y - 4.5);
});
} else if (shape === 'circle') {
points.forEach(function (item, index) {
context.moveTo(item.x + 3.5, item.y);
context.arc(item.x, item.y, 4, 0, 2 * Math.PI, false);
});
} else if (shape === 'rect') {
points.forEach(function (item, index) {
context.moveTo(item.x - 3.5, item.y - 3.5);
context.rect(item.x - 3.5, item.y - 3.5, 7, 7);
});
} else if (shape === 'triangle') {
points.forEach(function (item, index) {
context.moveTo(item.x, item.y - 4.5);
context.lineTo(item.x - 4.5, item.y + 4.5);
context.lineTo(item.x + 4.5, item.y + 4.5);
context.lineTo(item.x, item.y - 4.5);
});
}
context.closePath();
context.fill();
context.stroke();
}
function drawPointText(points, series, config, context) {
// 绘制数据文案
var data = series.data;
context.beginPath();
context.setFontSize(config.fontSize);
context.setFillStyle('#666666');
points.forEach(function (item, index) {
var formatVal = series.format ? series.format(data[index]) : data[index];
context.fillText(formatVal, item.x - mesureText(formatVal) / 2, item.y - 2);
});
context.closePath();
context.stroke();
}
function drawPieText(series, opts, config, context, radius, center) {
var lineRadius = radius + config.pieChartLinePadding;
var textRadius = lineRadius + config.pieChartTextPadding;
var textObjectCollection = [];
var lastTextObject = null;
var seriesConvert = series.map(function (item) {
var arc = 2 * Math.PI - (item._start_ + 2 * Math.PI * item._proportion_ / 2);
var text = item.format ? item.format(+item._proportion_.toFixed(2)) : util.toFixed(item._proportion_ * 100) + '%';
var color = item.color;
return { arc: arc, text: text, color: color };
});
seriesConvert.forEach(function (item) {
// line end
var orginX1 = Math.cos(item.arc) * lineRadius;
var orginY1 = Math.sin(item.arc) * lineRadius;
// line start
var orginX2 = Math.cos(item.arc) * radius;
var orginY2 = Math.sin(item.arc) * radius;
// text start
var orginX3 = orginX1 >= 0 ? orginX1 + config.pieChartTextPadding : orginX1 - config.pieChartTextPadding;
var orginY3 = orginY1;
var textWidth = mesureText(item.text);
var startY = orginY3;
if (lastTextObject && util.isSameXCoordinateArea(lastTextObject.start, { x: orginX3 })) {
if (orginX3 > 0) {
startY = Math.min(orginY3, lastTextObject.start.y);
} else if (orginX1 < 0) {
startY = Math.max(orginY3, lastTextObject.start.y);
} else {
if (orginY3 > 0) {
startY = Math.max(orginY3, lastTextObject.start.y);
} else {
startY = Math.min(orginY3, lastTextObject.start.y);
}
}
}
if (orginX3 < 0) {
orginX3 -= textWidth;
}
var textObject = {
lineStart: {
x: orginX2,
y: orginY2
},
lineEnd: {
x: orginX1,
y: orginY1
},
start: {
x: orginX3,
y: startY
},
width: textWidth,
height: config.fontSize,
text: item.text,
color: item.color
};
lastTextObject = avoidCollision(textObject, lastTextObject);
textObjectCollection.push(lastTextObject);
});
textObjectCollection.forEach(function (item) {
var lineStartPoistion = convertCoordinateOrigin(item.lineStart.x, item.lineStart.y, center);
var lineEndPoistion = convertCoordinateOrigin(item.lineEnd.x, item.lineEnd.y, center);
var textPosition = convertCoordinateOrigin(item.start.x, item.start.y, center);
context.setLineWidth(1);
context.setFontSize(config.fontSize);
context.beginPath();
context.setStrokeStyle(item.color);
context.setFillStyle(item.color);
context.moveTo(lineStartPoistion.x, lineStartPoistion.y);
var curveStartX = item.start.x < 0 ? textPosition.x + item.width : textPosition.x;
var textStartX = item.start.x < 0 ? textPosition.x - 5 : textPosition.x + 5;
context.quadraticCurveTo(lineEndPoistion.x, lineEndPoistion.y, curveStartX, textPosition.y);
context.moveTo(lineStartPoistion.x, lineStartPoistion.y);
context.stroke();
context.closePath();
context.beginPath();
context.moveTo(textPosition.x + item.width, textPosition.y);
context.arc(curveStartX, textPosition.y, 2, 0, 2 * Math.PI);
context.closePath();
context.fill();
context.beginPath();
context.setFillStyle('#666666');
context.fillText(item.text, textStartX, textPosition.y + 3);
context.closePath();
context.stroke();
context.closePath();
});
}
function drawYAxisTitle(title, opts, config, context) {
var startX = config.xAxisHeight + (opts.height - config.xAxisHeight - mesureText(title)) / 2;
context.save();
context.beginPath();
context.setFontSize(config.fontSize);
context.setFillStyle('#333333');
context.translate(0, opts.height);
context.rotate(-90 * Math.PI / 180);
context.fillText(title, startX, config.padding + 0.5 * config.fontSize);
context.stroke();
context.closePath();
context.restore();
}
function drawColumnDataPoints(series, opts, config, context) {
var process = arguments.length > 4 && arguments[4] !== undefined ? arguments[4] : 1;
var _calYAxisData = calYAxisData(series, opts, config),
ranges = _calYAxisData.ranges;
var _getXAxisPoints = getXAxisPoints(opts.categories, opts, config),
xAxisPoints = _getXAxisPoints.xAxisPoints,
eachSpacing = _getXAxisPoints.eachSpacing;
var minRange = ranges.pop();
var maxRange = ranges.shift();
var endY = opts.height - config.padding - config.xAxisHeight - config.legendHeight;
series.forEach(function (eachSeries, seriesIndex) {
var data = eachSeries.data;
var points = getDataPoints(data, minRange, maxRange, xAxisPoints, eachSpacing, opts, config, process);
points = fixColumeData(points, eachSpacing, series.length, seriesIndex, config);
// 绘制柱状数据图
context.beginPath();
context.setFillStyle(eachSeries.color);
points.forEach(function (item, index) {
var startX = item.x - item.width / 2 + 1;
var height = opts.height - item.y - config.padding - config.xAxisHeight - config.legendHeight;
context.moveTo(startX, item.y);
context.rect(startX, item.y, item.width - 2, height);
});
context.closePath();
context.fill();
});
series.forEach(function (eachSeries, seriesIndex) {
var data = eachSeries.data;
var points = getDataPoints(data, minRange, maxRange, xAxisPoints, eachSpacing, opts, config, process);
points = fixColumeData(points, eachSpacing, series.length, seriesIndex, config);
if (opts.dataLabel !== false && process === 1) {
drawPointText(points, eachSeries, config, context);
}
});
}
function drawAreaDataPoints(series, opts, config, context) {
var process = arguments.length > 4 && arguments[4] !== undefined ? arguments[4] : 1;
var _calYAxisData2 = calYAxisData(series, opts, config),
ranges = _calYAxisData2.ranges;
var _getXAxisPoints2 = getXAxisPoints(opts.categories, opts, config),
xAxisPoints = _getXAxisPoints2.xAxisPoints,
eachSpacing = _getXAxisPoints2.eachSpacing;
var minRange = ranges.pop();
var maxRange = ranges.shift();
var endY = opts.height - config.padding - config.xAxisHeight - config.legendHeight;
series.forEach(function (eachSeries, seriesIndex) {
var data = eachSeries.data;
var points = getDataPoints(data, minRange, maxRange, xAxisPoints, eachSpacing, opts, config, process);
// 绘制区域数据
var firstPoint = points[0];
var lastPoint = points[points.length - 1];
context.beginPath();
context.setStrokeStyle(eachSeries.color);
context.setFillStyle(eachSeries.color);
context.setGlobalAlpha(0.6);
context.setLineWidth(2);
context.moveTo(firstPoint.x, firstPoint.y);
points.forEach(function (item, index) {
if (index > 0) {
context.lineTo(item.x, item.y);
}
});
context.lineTo(lastPoint.x, endY);
context.lineTo(firstPoint.x, endY);
context.lineTo(firstPoint.x, firstPoint.y);
context.closePath();
context.fill();
context.setGlobalAlpha(1);
var shape = config.dataPointShape[seriesIndex % config.dataPointShape.length];
drawPointShape(points, eachSeries.color, shape, context);
});
if (opts.dataLabel !== false && process === 1) {
series.forEach(function (eachSeries, seriesIndex) {
var data = eachSeries.data;
var points = getDataPoints(data, minRange, maxRange, xAxisPoints, eachSpacing, opts, config, process);
drawPointText(points, eachSeries, config, context);
});
}
}
function drawLineDataPoints(series, opts, config, context) {
var process = arguments.length > 4 && arguments[4] !== undefined ? arguments[4] : 1;
var _calYAxisData3 = calYAxisData(series, opts, config),
ranges = _calYAxisData3.ranges;
var _getXAxisPoints3 = getXAxisPoints(opts.categories, opts, config),
xAxisPoints = _getXAxisPoints3.xAxisPoints,
eachSpacing = _getXAxisPoints3.eachSpacing;
var minRange = ranges.pop();
var maxRange = ranges.shift();
series.forEach(function (eachSeries, seriesIndex) {
var data = eachSeries.data;
var points = getDataPoints(data, minRange, maxRange, xAxisPoints, eachSpacing, opts, config, process);
// 绘制数据线
context.beginPath();
context.setStrokeStyle(eachSeries.color);
context.setLineWidth(2);
context.moveTo(points[0].x, points[0].y);
points.forEach(function (item, index) {
if (index > 0) {
context.lineTo(item.x, item.y);
}
});
context.moveTo(points[0].x, points[0].y);
context.closePath();
context.stroke();
var shape = config.dataPointShape[seriesIndex % config.dataPointShape.length];
drawPointShape(points, eachSeries.color, shape, context);
});
if (opts.dataLabel !== false && process === 1) {
series.forEach(function (eachSeries, seriesIndex) {
var data = eachSeries.data;
var points = getDataPoints(data, minRange, maxRange, xAxisPoints, eachSpacing, opts, config, process);
drawPointText(points, eachSeries, config, context);
});
}
}
function drawXAxis(categories, opts, config, context) {
var _getXAxisPoints4 = getXAxisPoints(categories, opts, config),
xAxisPoints = _getXAxisPoints4.xAxisPoints,
startX = _getXAxisPoints4.startX,
endX = _getXAxisPoints4.endX,
eachSpacing = _getXAxisPoints4.eachSpacing;
var startY = opts.height - config.padding - config.xAxisHeight - config.legendHeight;
var endY = opts.height - config.padding - config.legendHeight;
context.beginPath();
context.setStrokeStyle("#cccccc");
context.setLineWidth(1);
context.moveTo(startX, startY);
context.lineTo(endX, startY);
xAxisPoints.forEach(function (item, index) {
context.moveTo(item, startY);
context.lineTo(item, endY);
});
context.closePath();
context.stroke();
context.beginPath();
context.setFontSize(config.fontSize);
context.setFillStyle('#666666');
categories.forEach(function (item, index) {
var offset = eachSpacing / 2 - mesureText(item) / 2;
context.fillText(item, xAxisPoints[index] + offset, startY + config.fontSize + 5);
});
context.closePath();
context.stroke();
}
function drawYAxis(series, opts, config, context) {
var _calYAxisData4 = calYAxisData(series, opts, config),
rangesFormat = _calYAxisData4.rangesFormat;
var yAxisTotleWidth = config.yAxisWidth + config.yAxisTitleWidth;
var spacingValid = opts.height - 2 * config.padding - config.xAxisHeight - config.legendHeight;
var eachSpacing = Math.floor(spacingValid / config.yAxisSplit);
var startX = config.padding + yAxisTotleWidth;
var endX = opts.width - config.padding;
var startY = config.padding;
var endY = opts.height - config.padding - config.xAxisHeight - config.legendHeight;
var points = [];
for (var i = 0; i < config.yAxisSplit; i++) {
points.push(config.padding + eachSpacing * i);
}
context.beginPath();
context.setStrokeStyle("#cccccc");
context.setLineWidth(1);
points.forEach(function (item, index) {
context.moveTo(startX, item);
context.lineTo(endX, item);
});
context.closePath();
context.stroke();
context.beginPath();
context.setFontSize(config.fontSize);
context.setFillStyle('#666666');
rangesFormat.forEach(function (item, index) {
var pos = points[index] ? points[index] : endY;
context.fillText(item, config.padding + config.yAxisTitleWidth, pos + 10);
});
context.closePath();
context.stroke();
if (opts.yAxis.title) {
drawYAxisTitle(opts.yAxis.title, opts, config, context);
}
}
function drawLegend(series, opts, config, context) {
if (!opts.legend) {
return;
}
var padding = 5;
var width = 0;
series.forEach(function (item) {
item.name = item.name || 'undefined';
width += 2 * padding + mesureText(item.name) + 22.5;
});
var startX = (opts.width - width) / 2 + padding;
var startY = opts.height - config.legendHeight - 5;
context.setFontSize(config.fontSize);
series.forEach(function (item) {
switch (opts.type) {
case 'line':
context.beginPath();
context.setLineWidth(1);
context.setStrokeStyle(item.color);
context.moveTo(startX - 2, startY + 5);
context.lineTo(startX + 17, startY + 5);
context.stroke();
context.closePath();
context.beginPath();
context.setLineWidth(1);
context.setStrokeStyle('#ffffff');
context.setFillStyle(item.color);
context.moveTo(startX + 7.5, startY + 5);
context.arc(startX + 7.5, startY + 5, 4, 0, 2 * Math.PI);
context.fill();
context.stroke();
context.closePath();
break;
case 'pie':
case 'ring':
context.beginPath();
context.setFillStyle(item.color);
context.moveTo(startX + 7.5, startY + 5);
context.arc(startX + 7.5, startY + 5, 7, 0, 2 * Math.PI);
context.closePath();
context.fill();
break;
default:
context.beginPath();
context.setFillStyle(item.color);
context.moveTo(startX, startY);
context.rect(startX, startY, 15, 10);
context.closePath();
context.fill();
}
startX += padding + 15;
context.beginPath();
context.setFillStyle('#333333');
context.fillText(item.name, startX, startY + 9);
context.closePath();
context.stroke();
startX += mesureText(item.name) + padding + 7.5;
});
}
function drawPieDataPoints(series, opts, config, context) {
var process = arguments.length > 4 && arguments[4] !== undefined ? arguments[4] : 1;
series = getPieDataPoints(series, process);
var centerPosition = {
x: opts.width / 2,
y: (opts.height - config.legendHeight) / 2
};
var radius = Math.min(centerPosition.x - config.pieChartLinePadding - config.pieChartTextPadding - config._pieTextMaxLength_, centerPosition.y - config.pieChartLinePadding - config.pieChartTextPadding);
if (opts.dataLabel) {
radius -= 10;
} else {
radius -= 2 * config.padding;
}
series.forEach(function (eachSeries) {
context.beginPath();
context.setLineWidth(2);
context.setStrokeStyle('#ffffff');
context.setFillStyle(eachSeries.color);
context.moveTo(centerPosition.x, centerPosition.y);
context.arc(centerPosition.x, centerPosition.y, radius, eachSeries._start_, eachSeries._start_ + 2 * eachSeries._proportion_ * Math.PI);
context.closePath();
context.fill();
context.stroke();
});
if (opts.type === 'ring') {
context.beginPath();
context.setFillStyle('#ffffff');
context.moveTo(centerPosition.x, centerPosition.y);
context.arc(centerPosition.x, centerPosition.y, radius * 0.6, 0, 2 * Math.PI);
context.closePath();
context.fill();
}
if (opts.dataLabel !== false && process === 1) {
drawPieText(series, opts, config, context, radius, centerPosition);
}
}
function drawCanvas(opts, context) {
context.draw();
}
var Timing = {
easeIn: function easeIn(pos) {
return Math.pow(pos, 3);
},
easeOut: function easeOut(pos) {
return Math.pow(pos - 1, 3) + 1;
},
easeInOut: function easeInOut(pos) {
if ((pos /= 0.5) < 1) {
return 0.5 * Math.pow(pos, 3);
} else {
return 0.5 * (Math.pow(pos - 2, 3) + 2);
}
},
linear: function linear(pos) {
return pos;
}
};
function Animation(opts) {
opts.duration = typeof opts.duration === 'undefined' ? 1000 : opts.duration;
opts.timing = opts.timing || 'linear';
var delay = 17;
var createAnimationFrame = function createAnimationFrame() {
if (typeof requestAnimationFrame !== 'undefined') {
return requestAnimationFrame;
} else if (typeof setTimeout !== 'undefined') {
return function (step, delay) {
setTimeout(function () {
var timeStamp = +new Date();
step(timeStamp);
}, delay);
};
} else {
return function (step) {
step(null);
};
}
};
var animationFrame = createAnimationFrame();
var startTimeStamp = null;
function step(timestamp) {
if (timestamp === null) {
opts.onProcess && opts.onProcess(1);
opts.onAnimationFinish && opts.onAnimationFinish();
return;
}
if (startTimeStamp === null) {
startTimeStamp = timestamp;
}
if (timestamp - startTimeStamp < opts.duration) {
var process = (timestamp - startTimeStamp) / opts.duration;
var timingFunction = Timing[opts.timing];
process = timingFunction(process);
opts.onProcess && opts.onProcess(process);
animationFrame(step, delay);
} else {
opts.onProcess && opts.onProcess(1);
opts.onAnimationFinish && opts.onAnimationFinish();
}
}
animationFrame(step, delay);
}
function drawCharts(type, opts, config, context) {
var series = opts.series;
var categories = opts.categories;
series = fillSeriesColor(series, config);
var _calYAxisData = calYAxisData(series, opts, config),
yAxisWidth = _calYAxisData.yAxisWidth;
config.yAxisWidth = yAxisWidth;
config._pieTextMaxLength_ = getPieTextMaxLength(series);
var duration = opts.animation ? 1000 : 0;
switch (type) {
case 'line':
Animation({
timing: 'easeIn',
duration: duration,
onProcess: function onProcess(process) {
drawYAxis(series, opts, config, context);
drawXAxis(categories, opts, config, context);
drawLineDataPoints(series, opts, config, context, process);
drawLegend(opts.series, opts, config, context);
drawCanvas(opts, context);
}
});
break;
case 'column':
Animation({
timing: 'easeIn',
duration: duration,
onProcess: function onProcess(process) {
drawYAxis(series, opts, config, context);
drawXAxis(categories, opts, config, context);
drawColumnDataPoints(series, opts, config, context, process);
drawLegend(opts.series, opts, config, context);
drawCanvas(opts, context);
}
});
break;
case 'area':
Animation({
timing: 'easeIn',
duration: duration,
onProcess: function onProcess(process) {
drawYAxis(series, opts, config, context);
drawXAxis(categories, opts, config, context);
drawAreaDataPoints(series, opts, config, context, process);
drawLegend(opts.series, opts, config, context);
drawCanvas(opts, context);
}
});
break;
case 'ring':
case 'pie':
Animation({
timing: 'easeInOut',
duration: duration,
onProcess: function onProcess(process) {
drawPieDataPoints(series, opts, config, context, process);
drawLegend(opts.series, opts, config, context);
drawCanvas(opts, context);
}
});
break;
}
}
var Charts = function Charts(opts) {
opts.yAxis = opts.yAxis || {};
opts.legend = opts.legend === false ? false : true;
opts.animation = opts.animation === false ? false : true;
var config$$1 = assign({}, config);
config$$1.legendHeight = opts.legend ? config$$1.legendHeight : 0;
config$$1.yAxisTitleWidth = opts.yAxis.title ? config$$1.yAxisTitleWidth : 0;
config$$1.pieChartLinePadding = opts.dataLabel === false ? 0 : config$$1.pieChartLinePadding;
config$$1.pieChartTextPadding = opts.dataLabel === false ? 0 : config$$1.pieChartTextPadding;
var context = wx.createCanvasContext(opts.canvasId);
drawCharts(opts.type, opts, config$$1, context);
};
module.exports = Charts;
下载地址:财经
关注公众号“大模型全栈程序员”回复“小程序”获取1000个小程序打包源码。更多免费资源在http://www.gitweixin.com/?p=2627